
TrustRadius Insights
Rational BI has proven to be a valuable tool for users seeking to categorize and analyze big data, enabling them to derive meaningful …
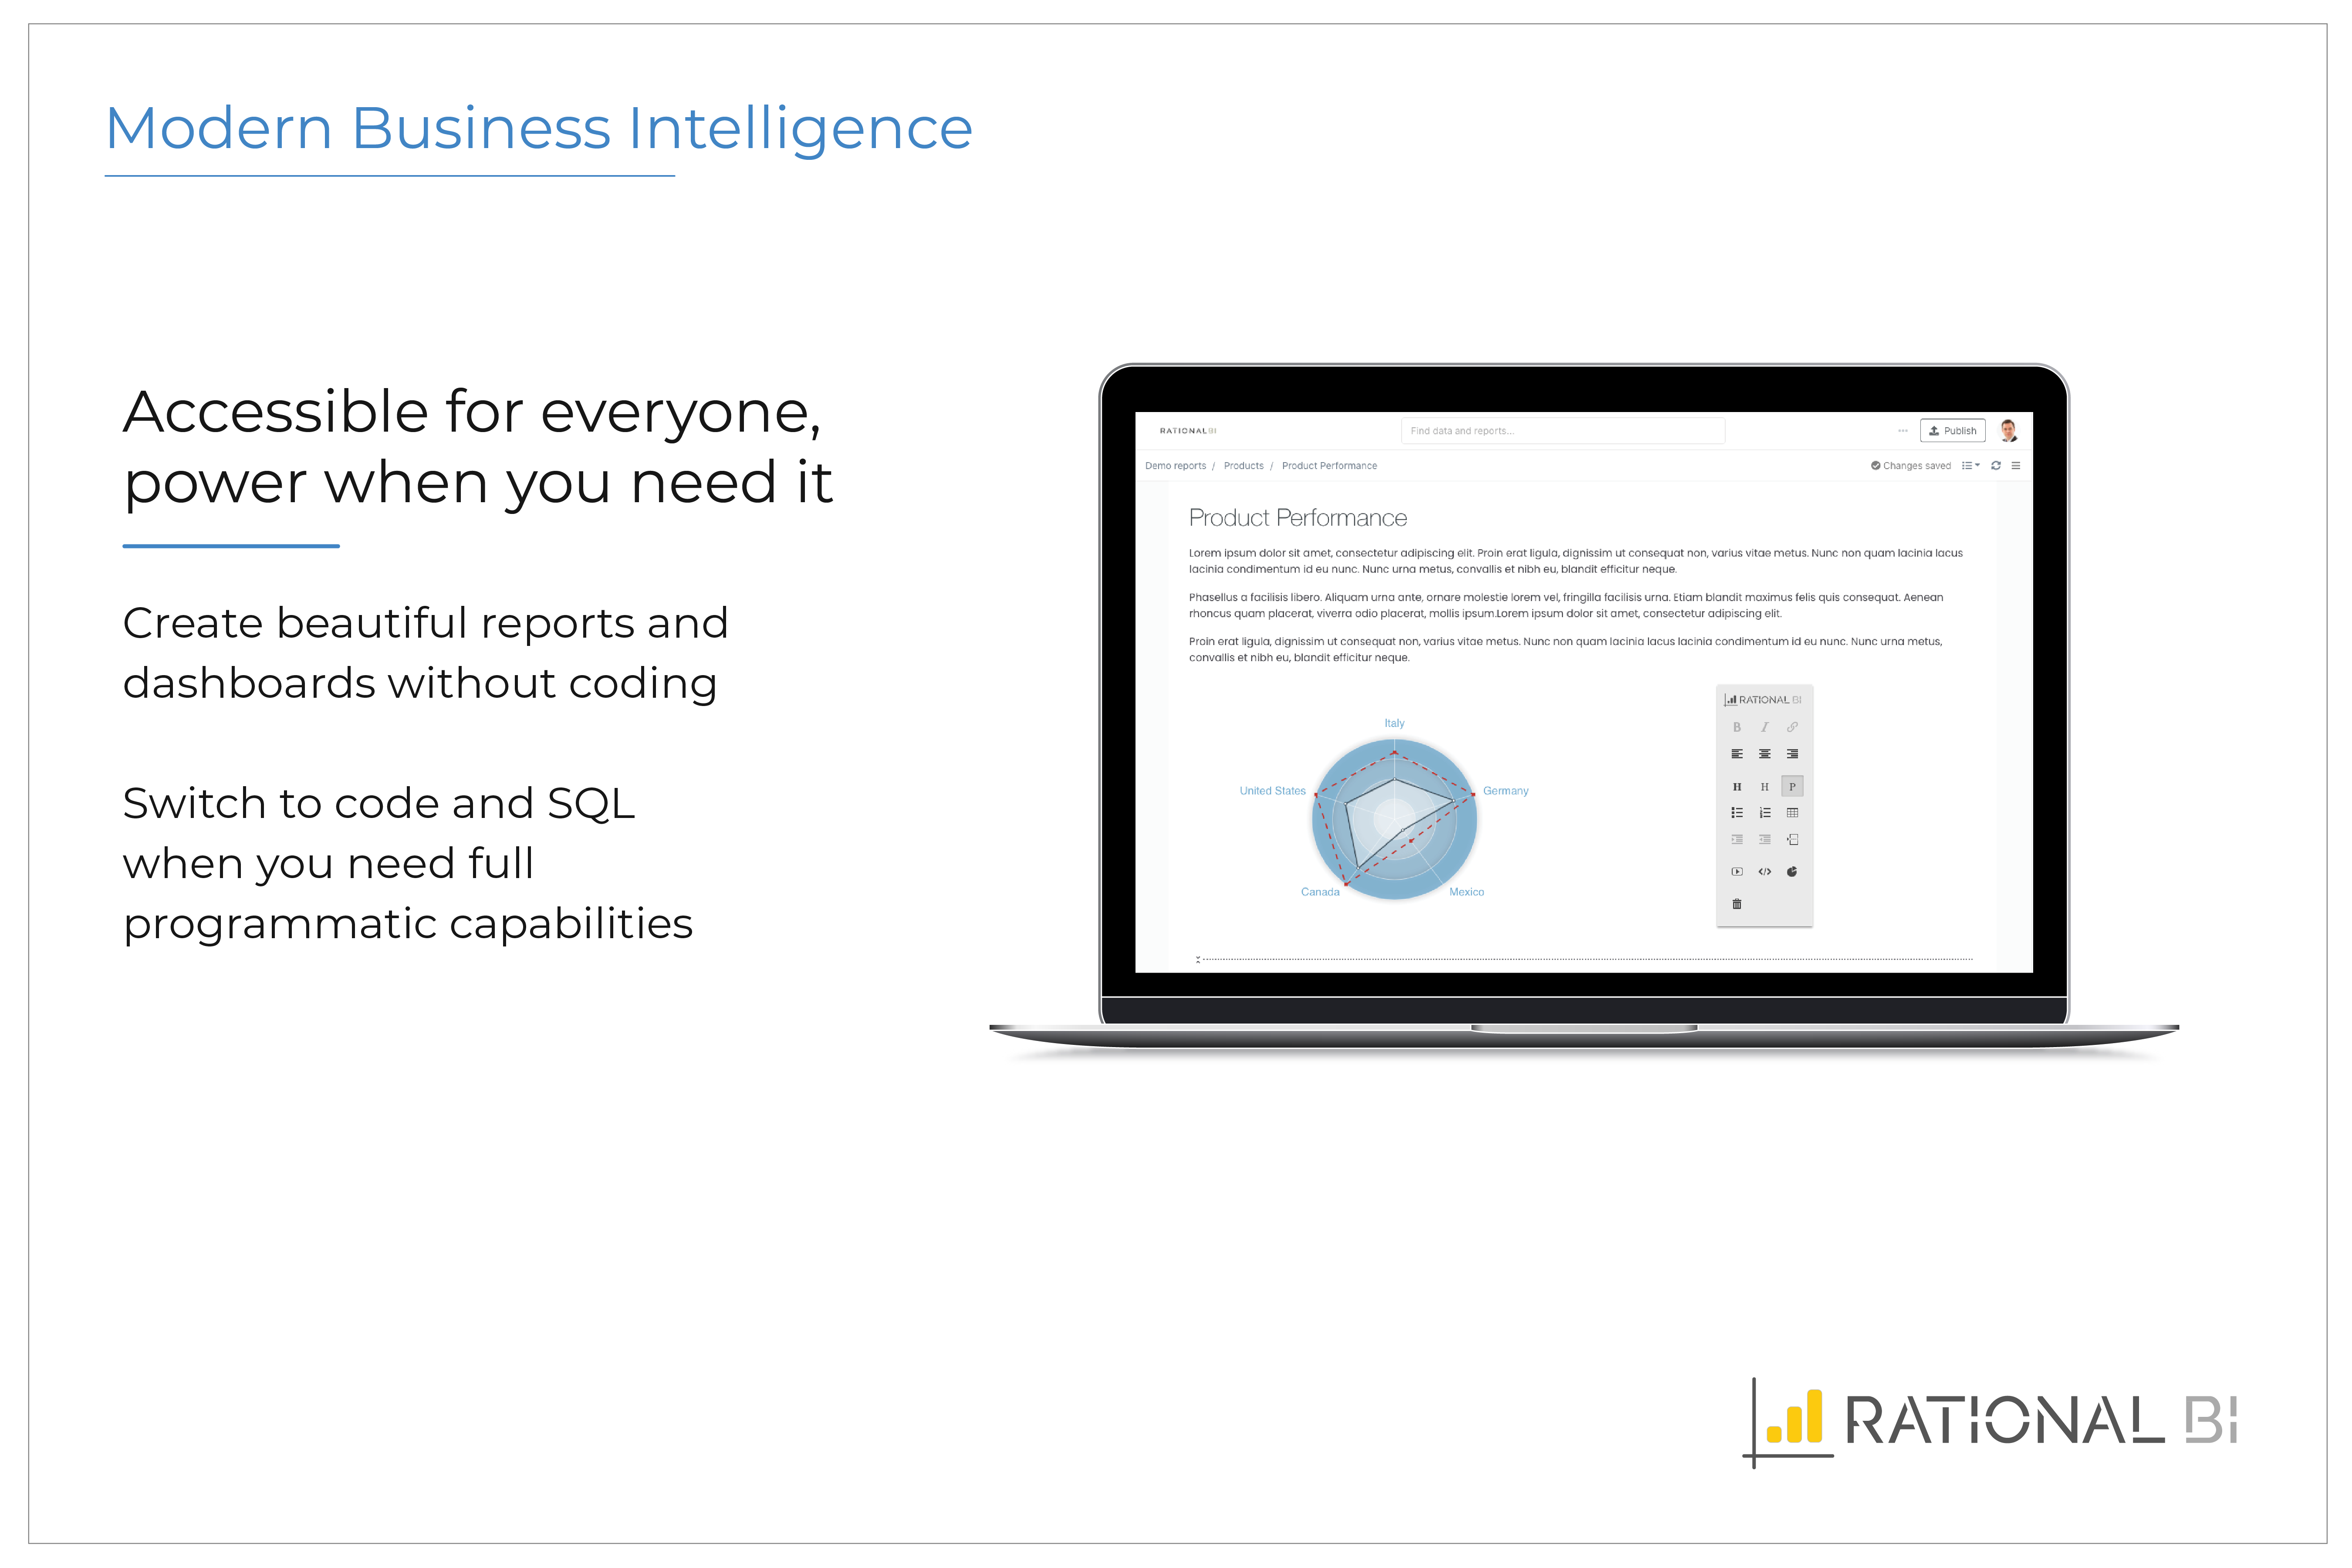
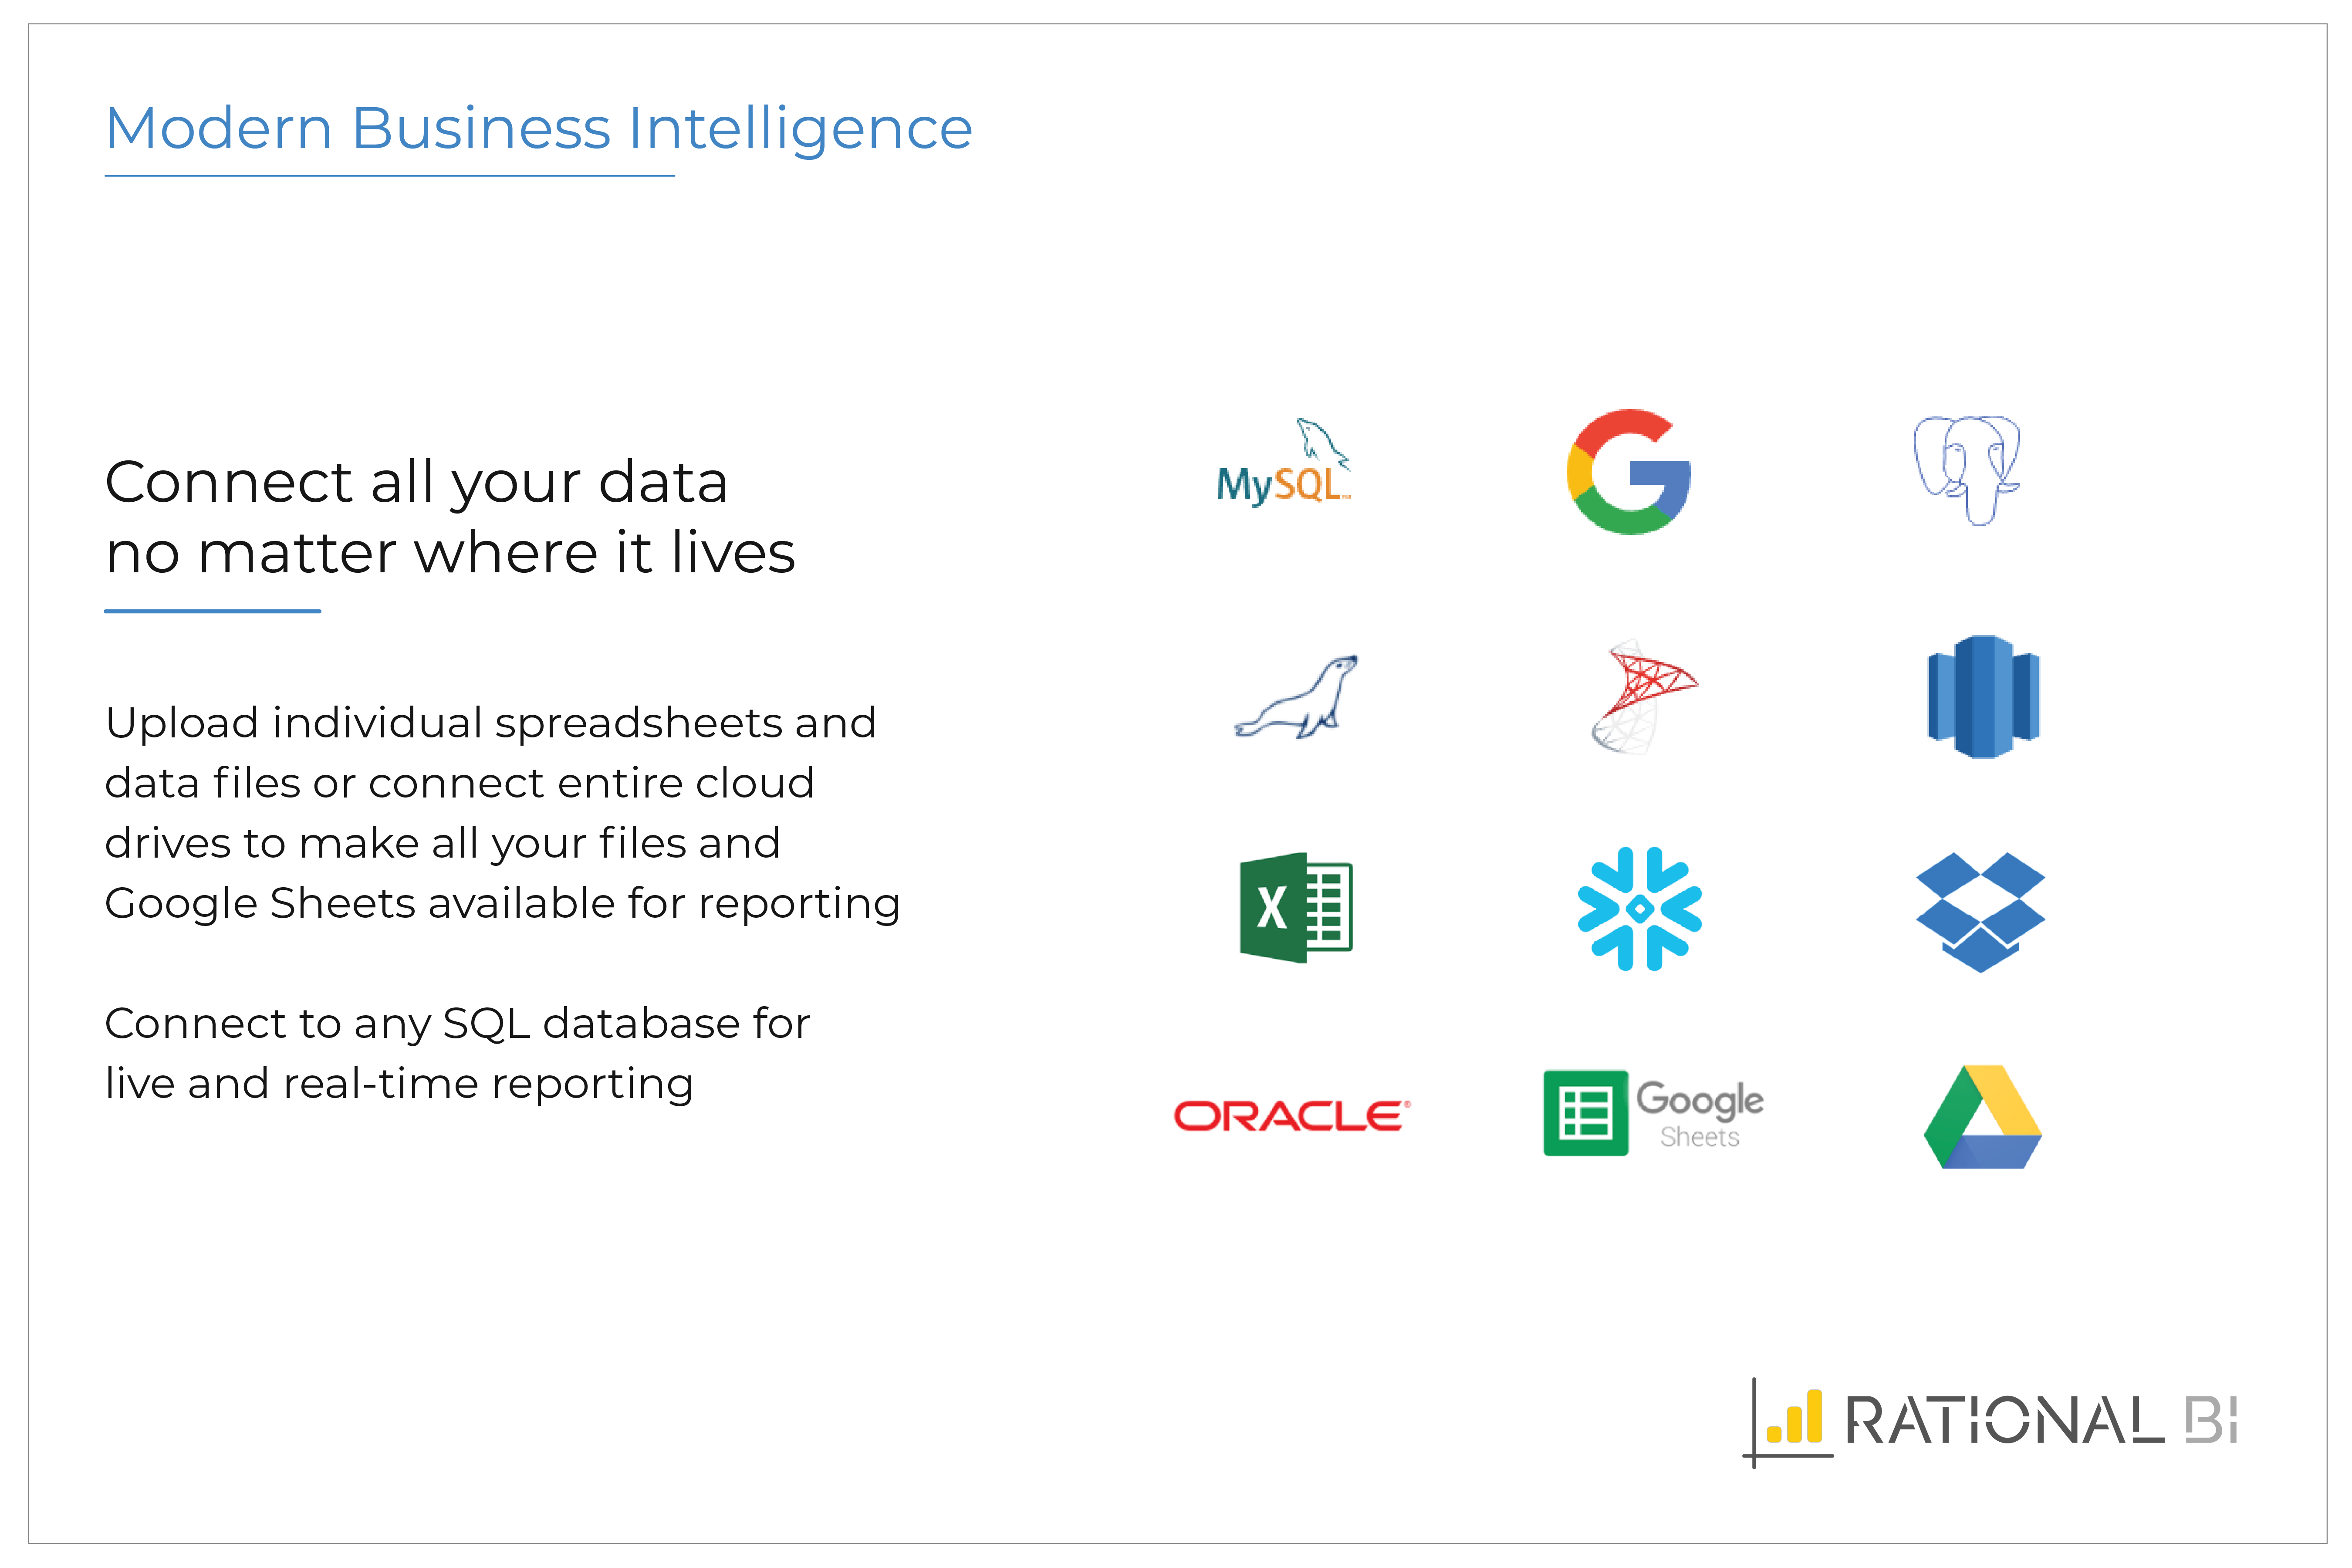
Rational BI provides analytics, data science and business intelligence in an analytical platform that connects to databases, data files and cloud drives including AWS and Azure data sources, enabling users to explore and visualize data.Users can build real-time notebook-style reports…


| Deployment Types | Software as a Service (SaaS), Cloud, or Web-Based |
|---|---|
| Operating Systems | Unspecified |
| Mobile Application | No |
| Supported Countries | Worldwide |
| Supported Languages | English |
| Consumers | 0% |
|---|---|
| Small Businesses (1-50 employees) | 25% |
| Mid-Size Companies (51-500 employees) | 25% |
| Enterprises (more than 500 employees) | 50% |
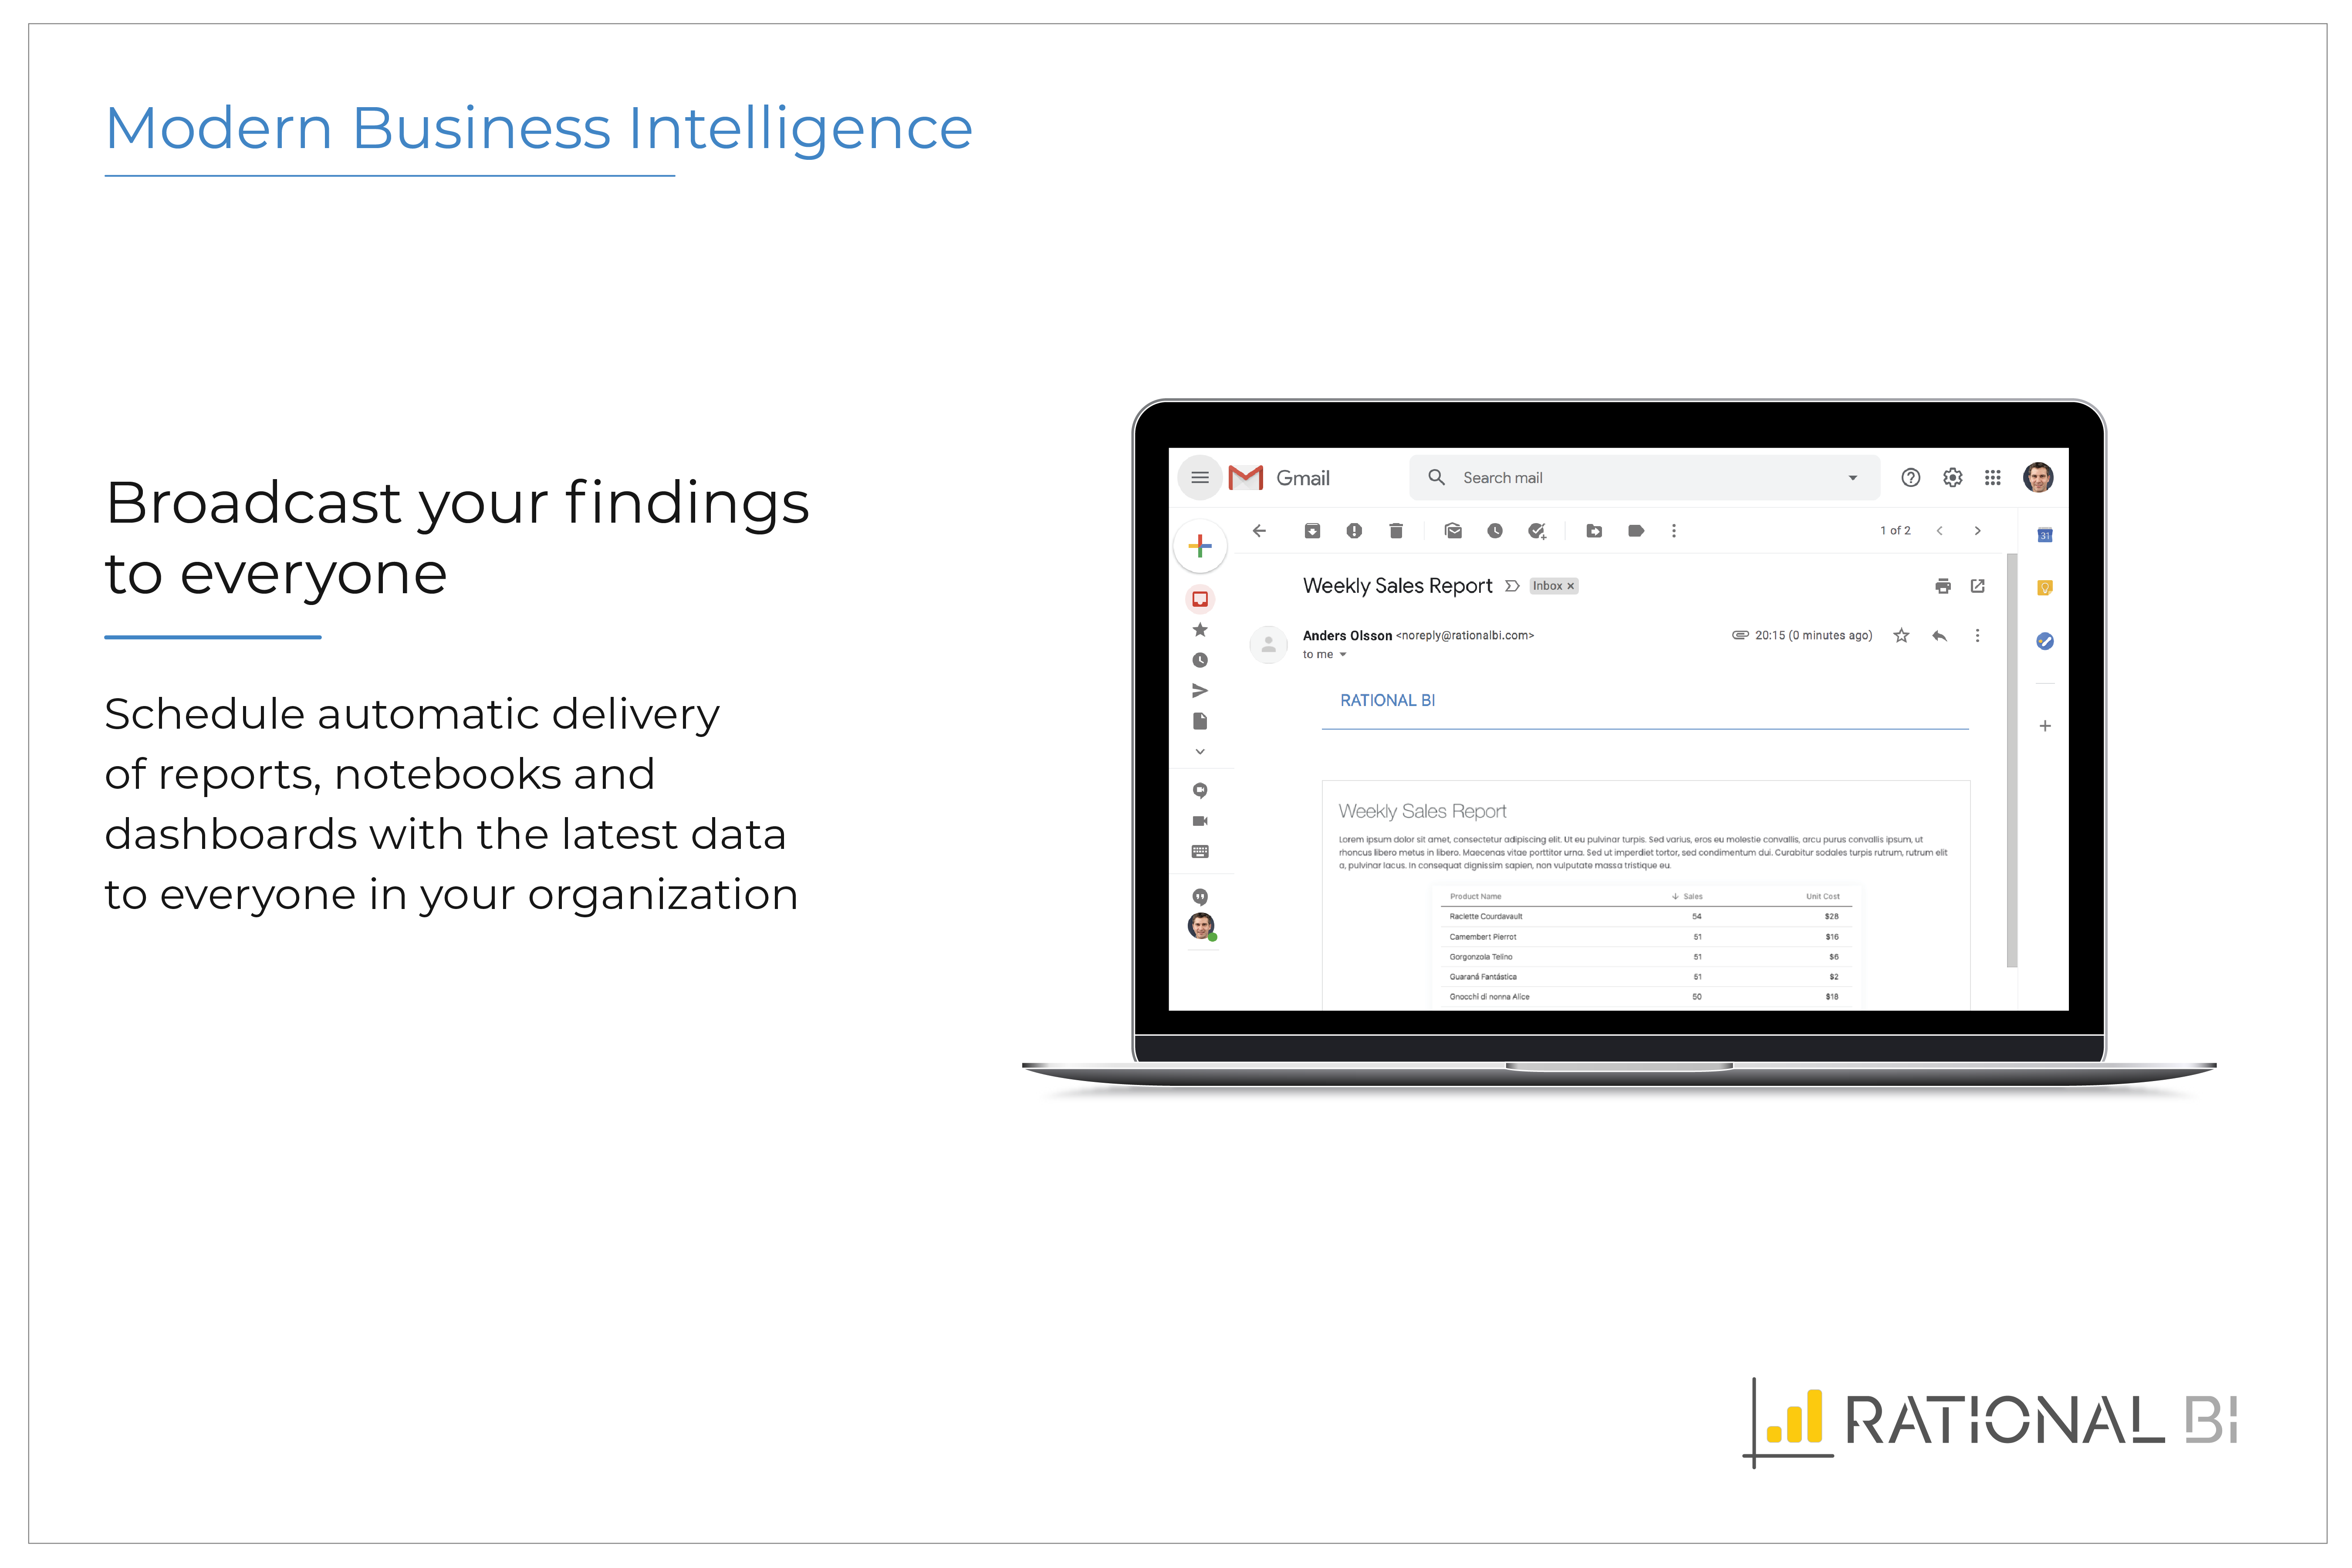
Rational BI has proven to be a valuable tool for users seeking to categorize and analyze big data, enabling them to derive meaningful insights. Companies particularly appreciate the product's ability to leverage SQL in almost all layers, which helps reduce time to market for internal clients. With Rational BI, users can address a diverse range of analytical problems including providing BI tools, data science capabilities, data transformation, and generating insights. By connecting all data sources in one centralized location, Rational BI offers a comprehensive analytics solution. This product also provides various reporting options, allowing users to customize reporting and data analytics for different users or groups. The highly customizable data visualization options, such as graphing and flow charts, are useful for data governance and can even be integrated into a company portal if desired. Users have noted that displaying graphs and numbers on large screens using Rational BI encourages data-driven decision-making within their organizations. Furthermore, this tool is employed for managing and presenting report analyses from different projects, facilitating the creation of useful reports and dashboards. Rational BI also enables the automatic scheduling and delivery of reports to stakeholders, streamlining the dissemination of information. Users appreciate the ease with which they can share information with managers and collaborators in a rational view, with the ability to customize arrangements according to their needs. Another use case of Rational BI involves driving insights into customer usage and identifying pain points through data metrics. The product allows for quick and easy setup of reports and dashboards, enabling users to track meaningful KPIs for improving performance and customer experience.
Data Conversion Capability: Several users have praised Rational BI for its ability to convert data files into live databases. This feature has been highlighted by multiple reviewers as a key strength of the product, enabling them to effectively analyze and report on their data.
High Accuracy in Data Analysis: Reviewers have consistently mentioned the high accuracy provided by Rational BI in data analysis. This level of precision adds significant value to their reports and situation estimates, allowing them to make informed decisions and recommendations with confidence.
Flexibility in Data Source Connectivity: The flexibility offered by Rational BI in terms of connecting to various data sources has been appreciated by users. They have found it beneficial to be able to access and utilize data from different sources, enhancing the overall capabilities of the product.
Usability and Interface: Some users have expressed that the tool's user experience needs development, indicating room for improvement in terms of usability and interface. They feel that certain aspects could be more intuitive and logical.
Lack of Pricing Clarity: Reviewers have mentioned that pricing information is not clearly stated on the website, requiring potential users to contact a customer representative. This lack of transparency can be inconvenient, particularly for small businesses or personal use.
Limited Data Source Connectivity: Users have suggested enhancing the capabilities to connect with other data sources. They also highlighted the need for improvements in the user interface, particularly for novice users who may find it challenging to navigate and utilize these features effectively.